




Starplot is a Python library for creating star charts and maps of the sky
- 🗺️ Maps - including 10+ customizable projections
- ⭐ Zenith Charts - shows the entire sky at a specific time and place
- 🌅 Horizon Charts - shows the horizon at a specific time and place
- 🔭 Optic Simulations - shows what you'll see through an optic (e.g. telescope) at a specific time and place
- 🌌 Galactic Charts - shows a Mollweide projection in galactic coordinates
- 🪐 Planets and Deep Sky Objects (DSOs) - with support for plotting their true extent
- ☄️ Comets and Satellites - easy trajectory plotting
- 🎨 Custom Styles - for all objects and with 8+ built-in themes
- 📥 Export - png, svg, jpeg
- 🌐 Interactive web export - Plotly 6 charts backed by compact Arrow Scene bundles
- 🚀 Data Backend - powered by DuckDB + Ibis for fast object lookup
- 📓 Custom Data Catalogs - with helpers for building and optimizing
- 🧭 Label Collision Avoidance - ensuring all labels are readable
- 🌐 Localization - label translations for Chinese, French, Italian, Lithuanian, Persian, and Spanish
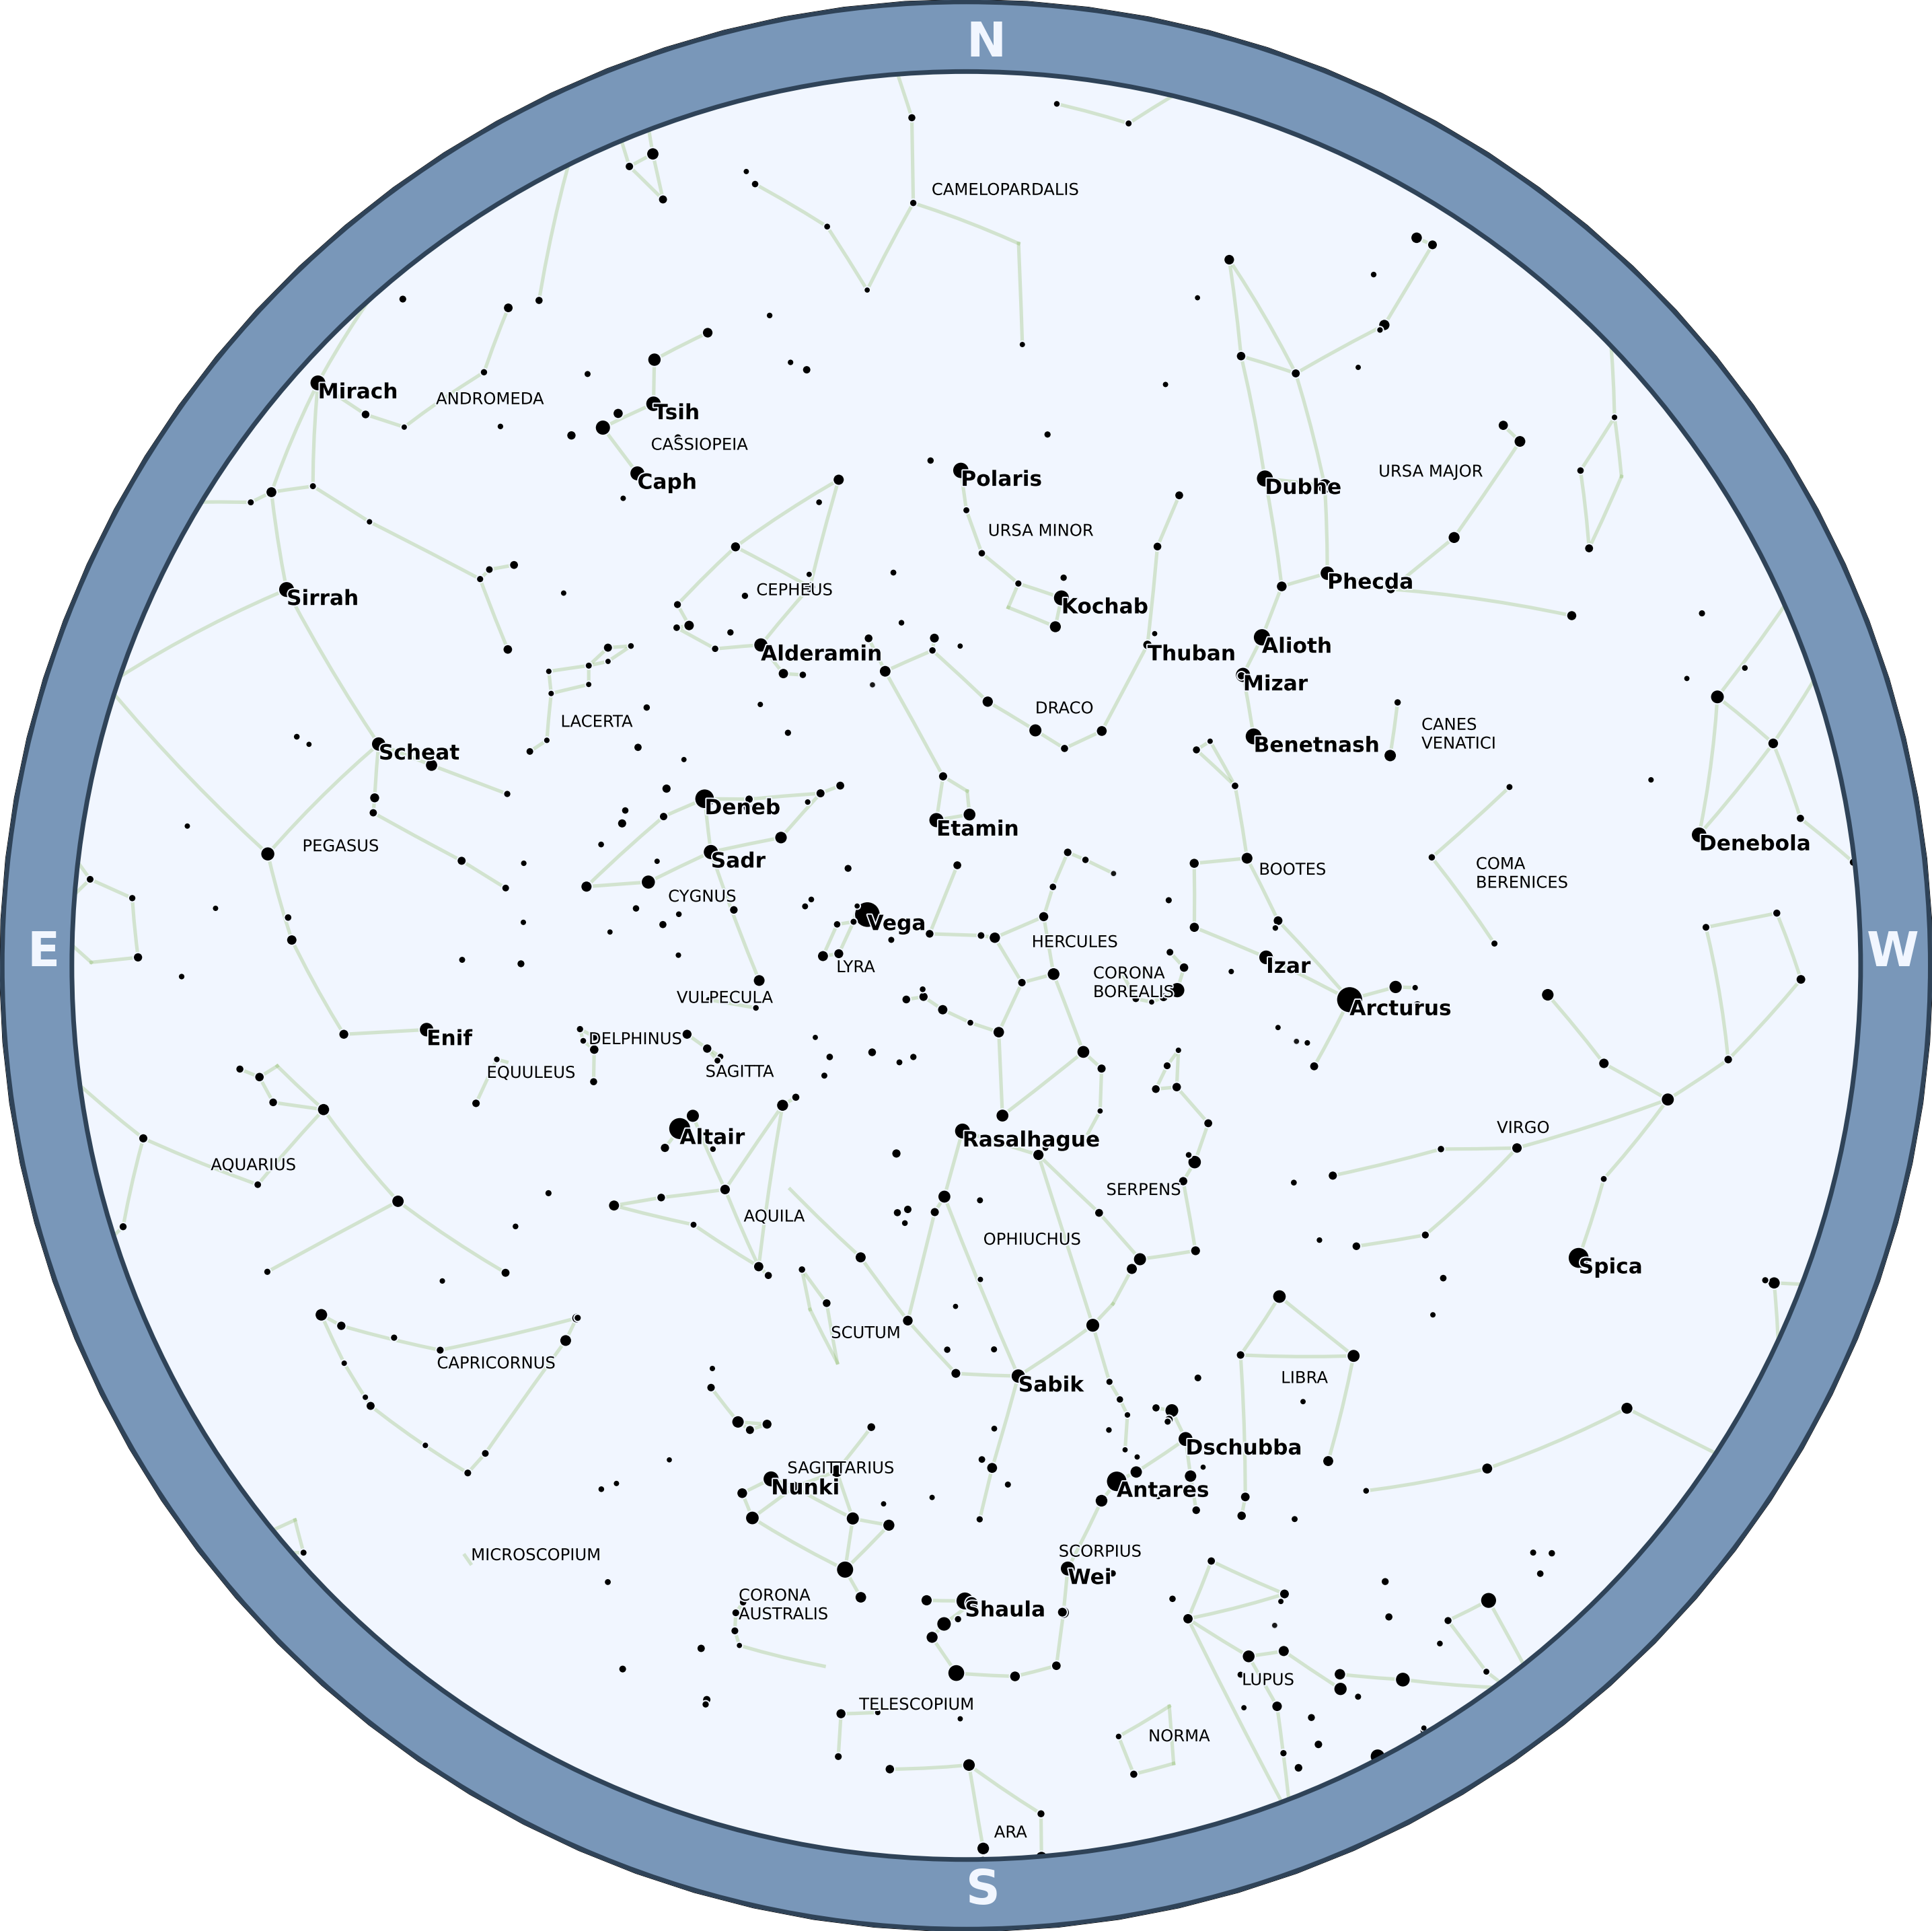
Zenith chart of the stars from a specific time/location:
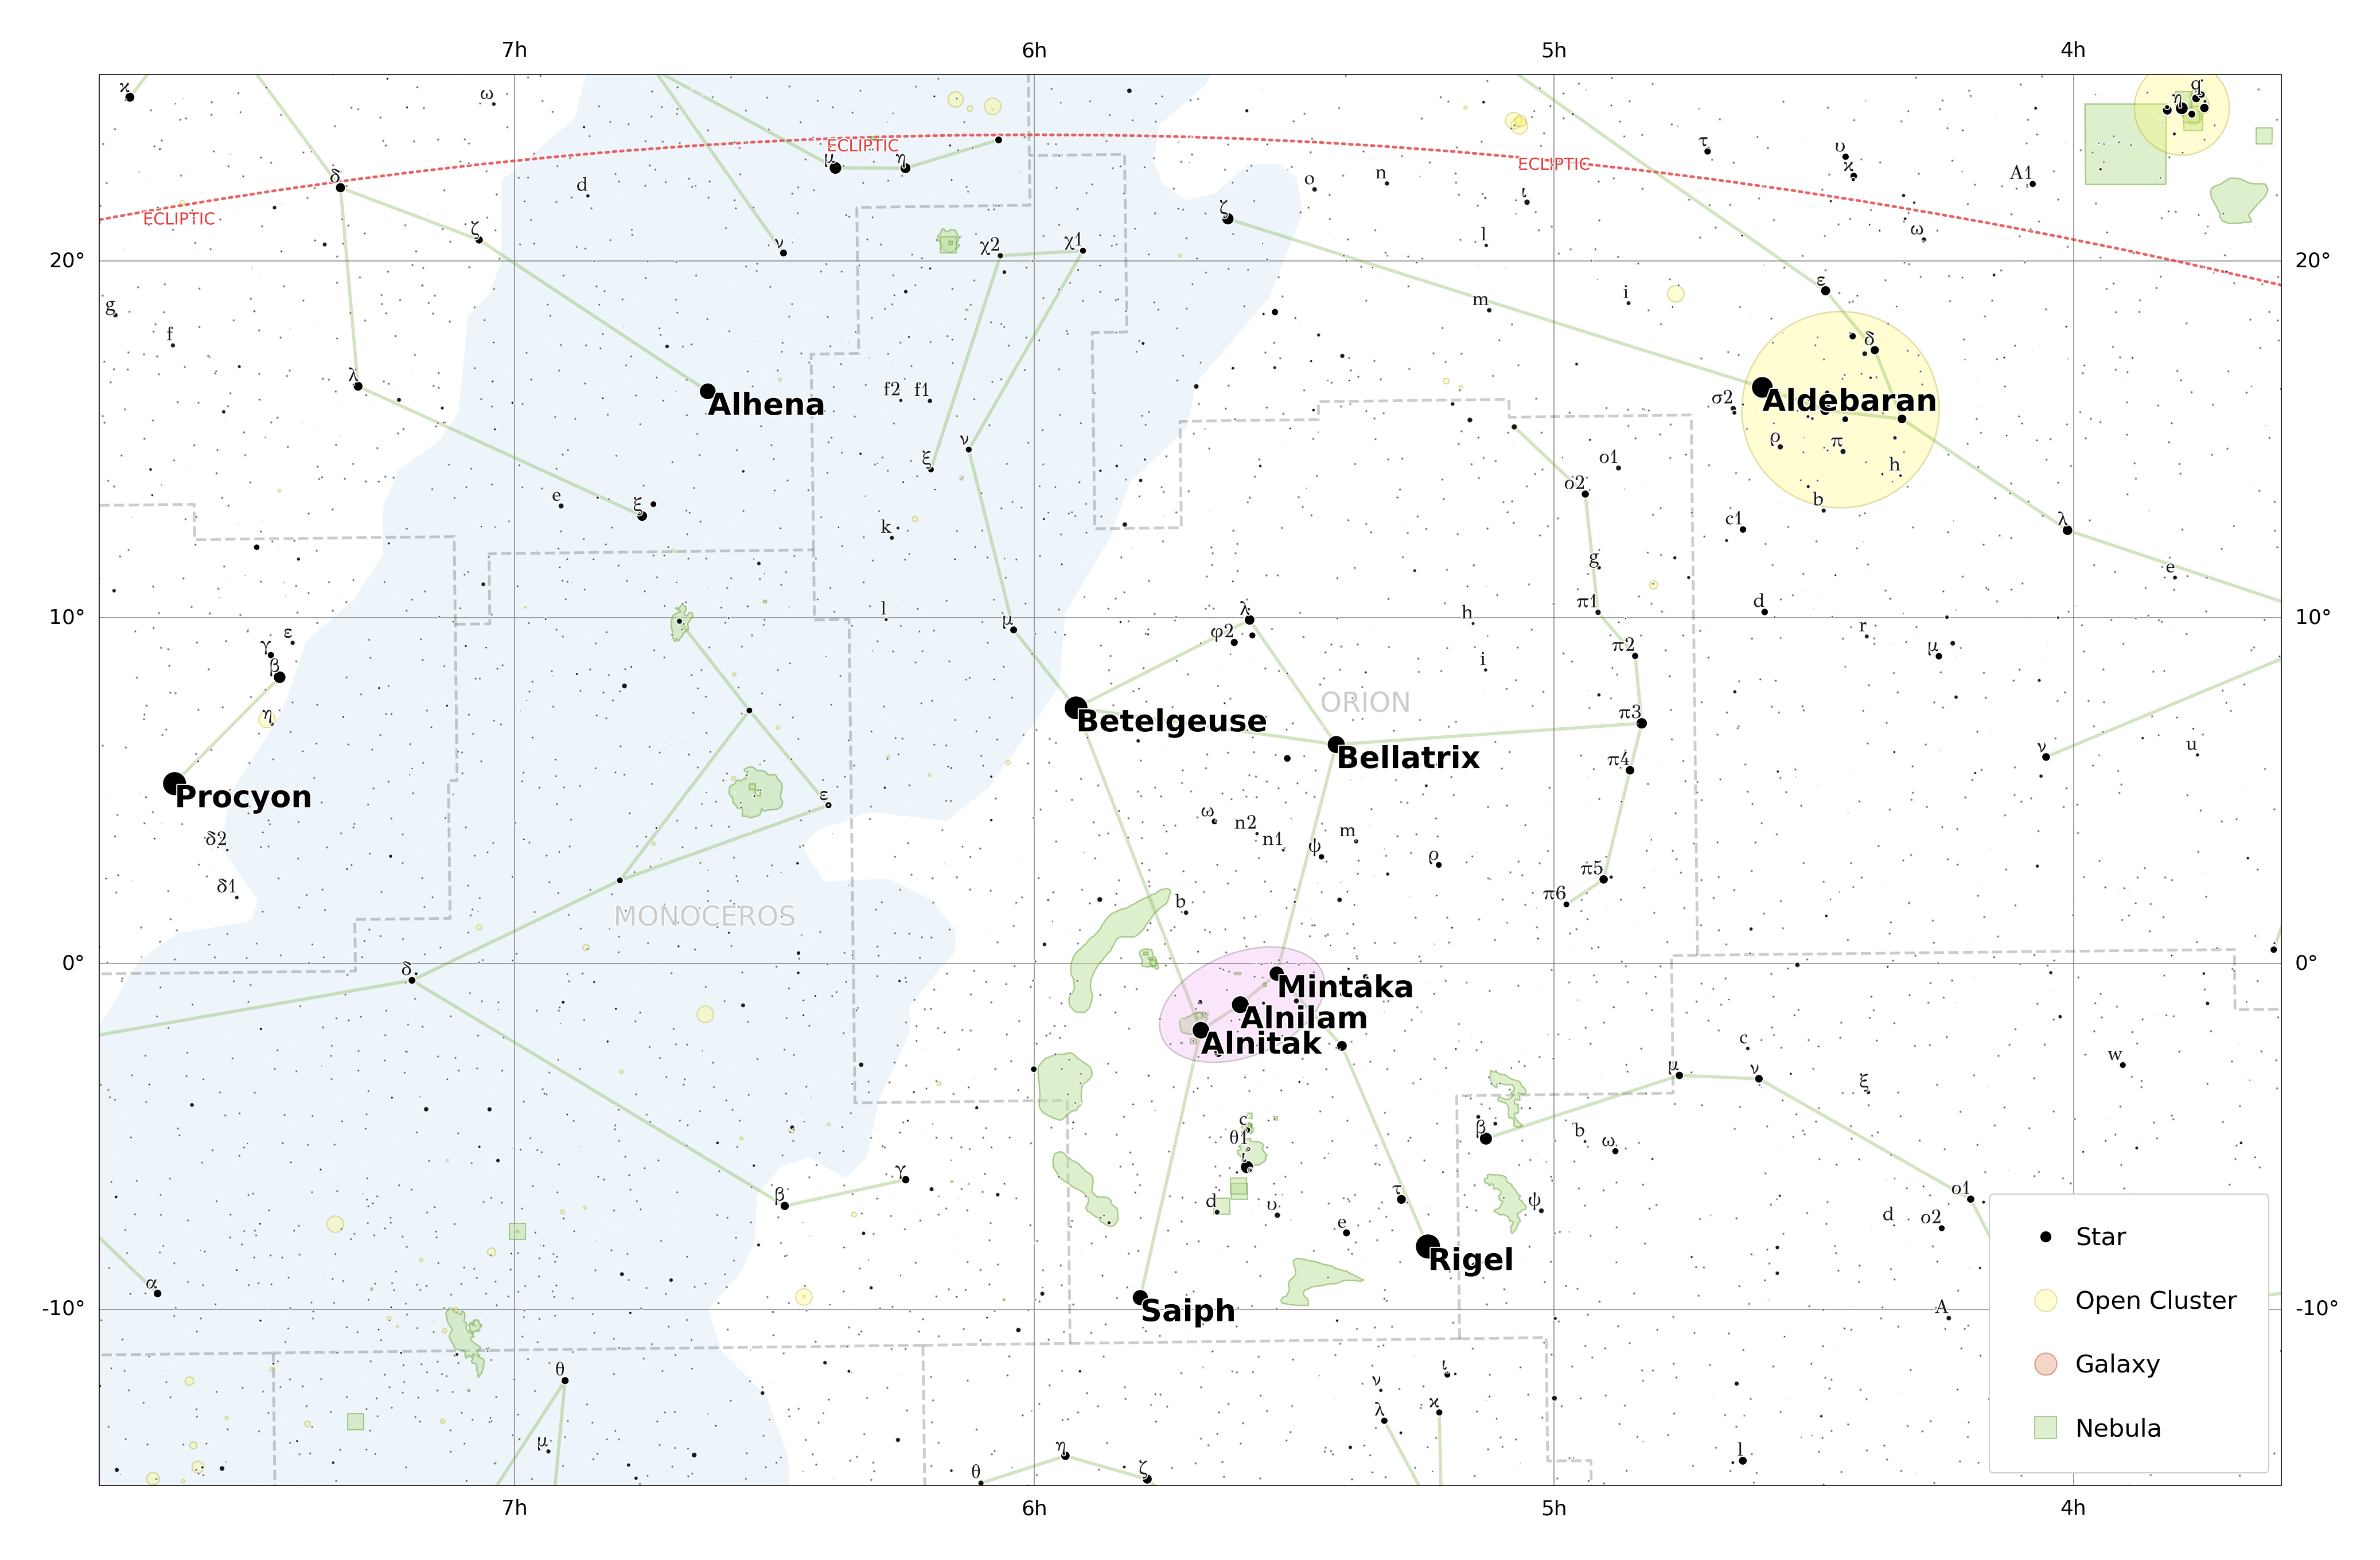
Map around the constellation Orion:
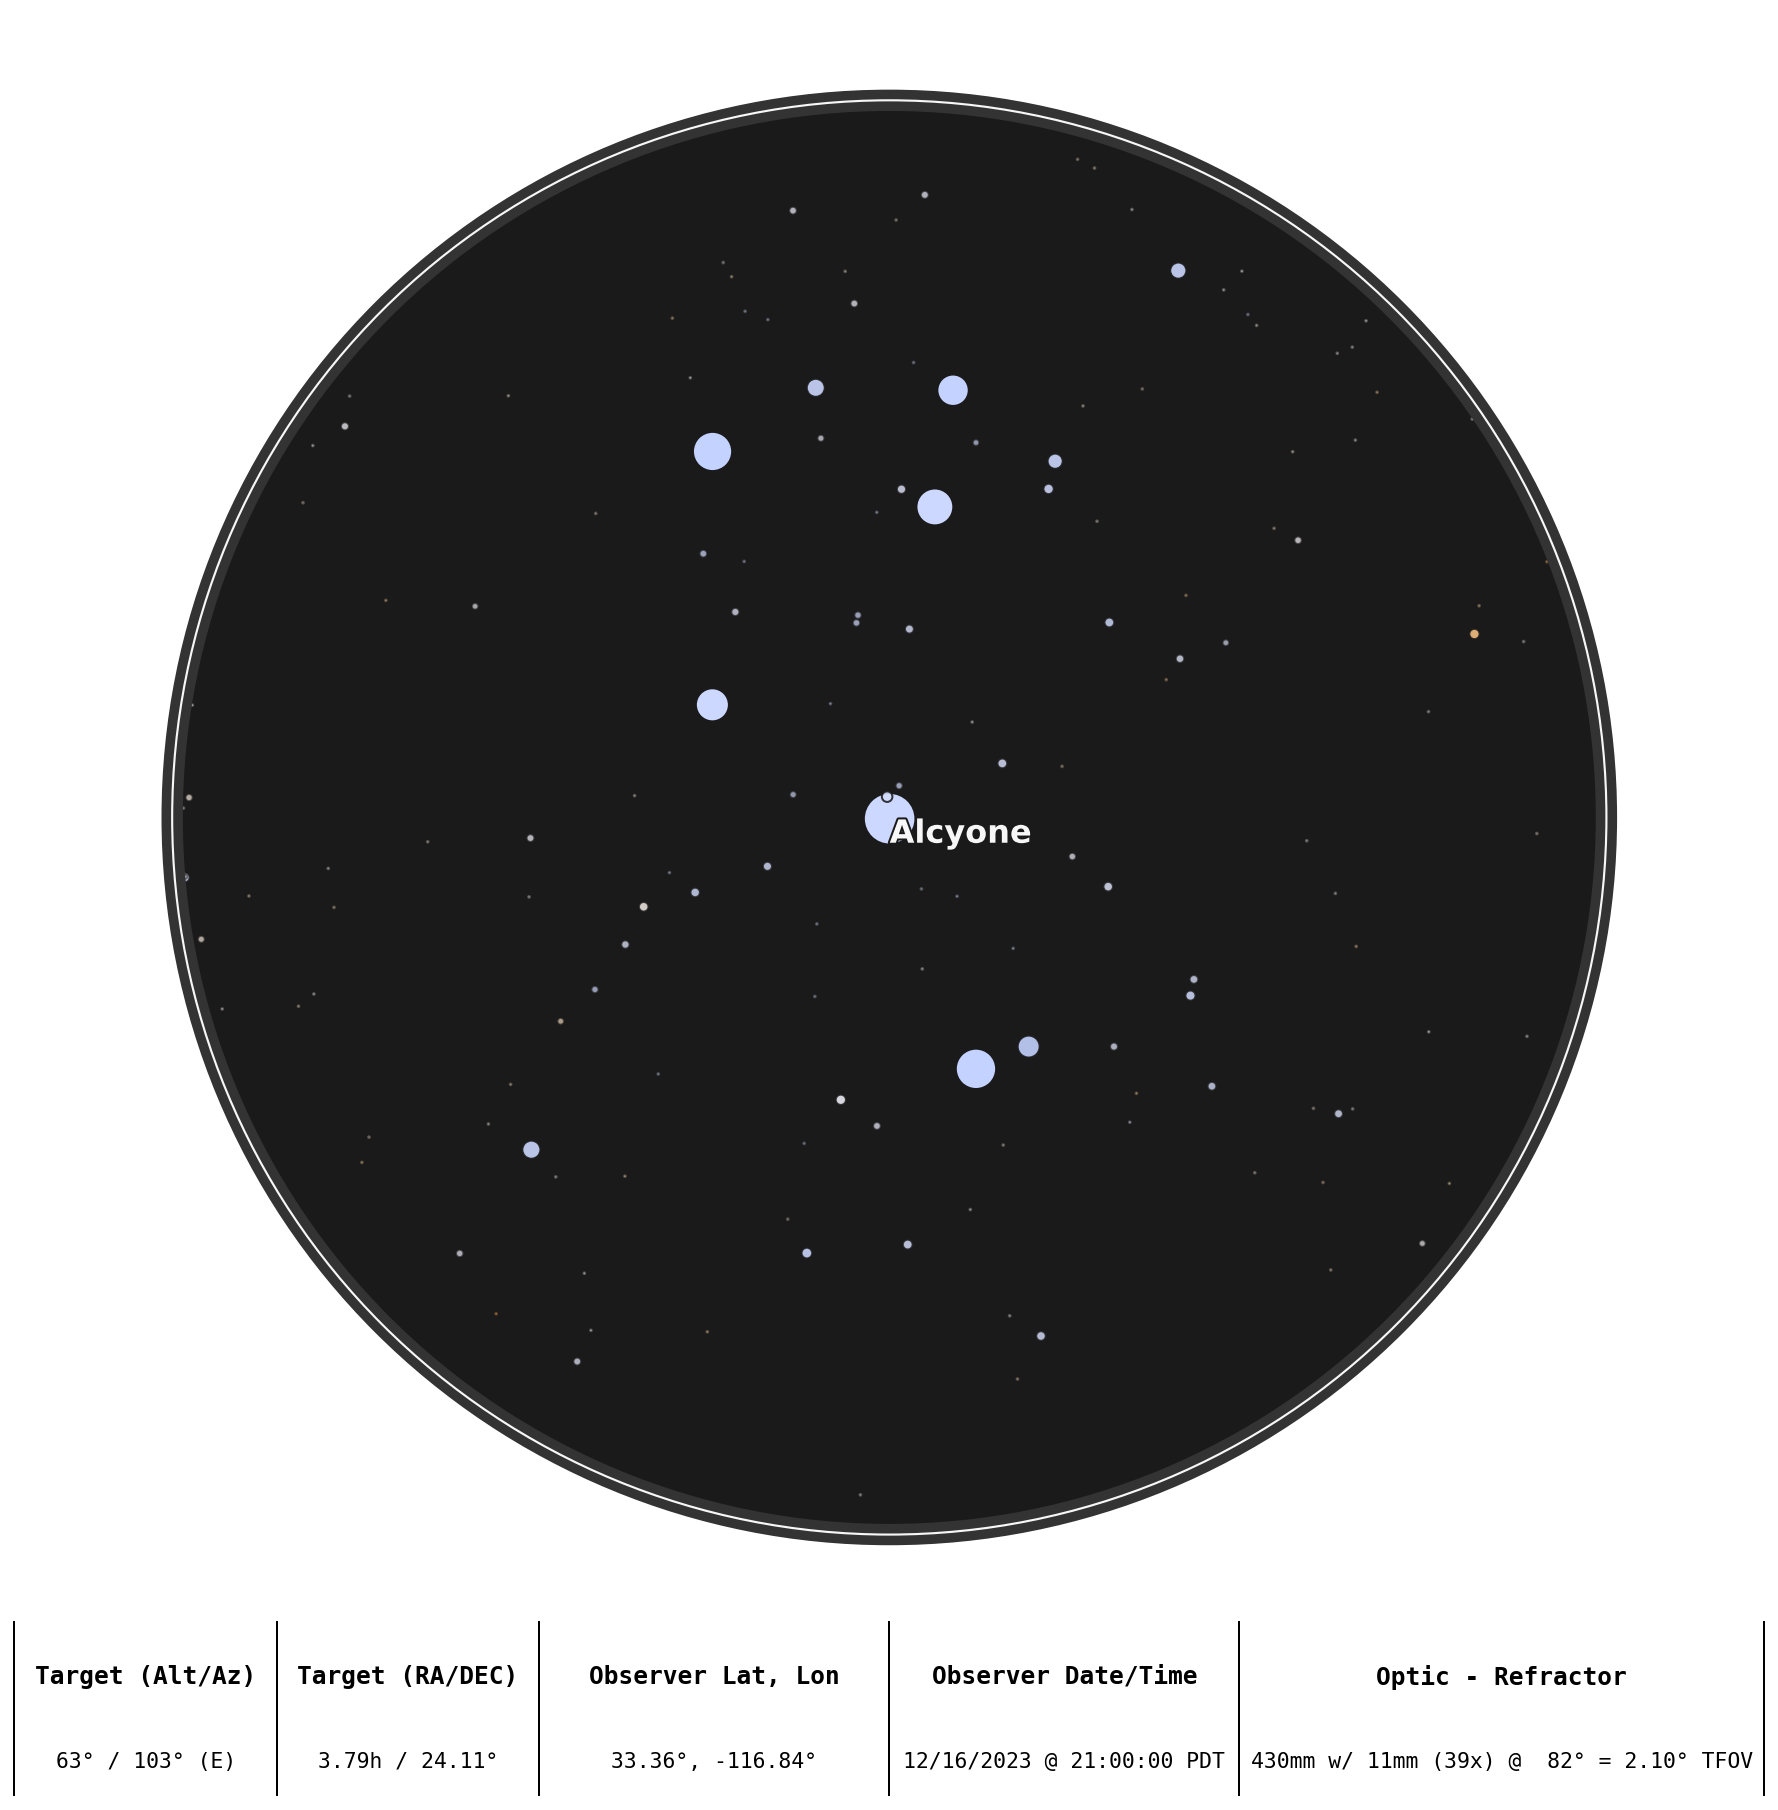
The Pleiades star cluster, as seen through a refractor telescope from a specific time and location:
To create a star chart for tonight's sky as seen from Palomar Mountain in California:
from datetime import datetime
from zoneinfo import ZoneInfo

from starplot import ZenithPlot, Observer, styles, _

tz = ZoneInfo("America/Los_Angeles")
dt = datetime.now(tz).replace(hour=22)

observer = Observer(
    dt=dt,
    lat=33.363484,
    lon=-116.836394,
)

p = ZenithPlot(
    observer=observer,
    style=styles.PlotStyle().extend(
        styles.extensions.BLUE_MEDIUM,
    ),
    resolution=4096,
    autoscale=True,
)
p.constellations()
p.stars(where=[_.magnitude < 4.6])
p.constellation_labels()
p.horizon()
p.export("starchart.png")The interactive plot classes compile the final Matplotlib geometry into one
backend-neutral Scene. to_plotly() returns a Plotly figure for notebooks,
while export_html() writes a web chart. External Scene bundles are the
default: serve them over HTTP with starplot serve.
from starplot.interactive import InteractiveMapPlot

# Build and draw an InteractiveMapPlot as usual, then:
plot.export_html("chart.html")  # chart.html and chart.scene/
plot.export_html("chart-inline.html", data_mode="inline")  # works with file://
plot.export_html(
    "chart-api.html", data_mode="remote",
    data_url="https://example.org/api/scenes/orion",
)
figure = plot.to_plotly()
starplot serve . --port 8000See interactive web export for
remote SceneProvider integration, caching, viewport/LOD behavior, and
security limits. Users upgrading an existing Plotly workflow should also read
the Plotly 6 and Arrow migration notes.
For a demo of Starplot's zenith charts, check out:
Sky Atlas - Star Chart Creator
- Chat with other starplotters on our Discord server
- Follow us on Bluesky
- Join our newsletter
- See more examples at Starplotting.com
Contributing to Starplot is welcome and very much appreciated! Please see here for details.
- 🧮 Coordinate system helpers
- 🌑 Planet moons
- ✴️ Custom markers
- 😄 🔭 Clear skies
See more details on the Public Roadmap